Some friends and I recently spoke about understanding our home energy usage better, and implementing data collection for various circuits in which we had little real visibility into the actual usage and how they contributed to our energy bills.
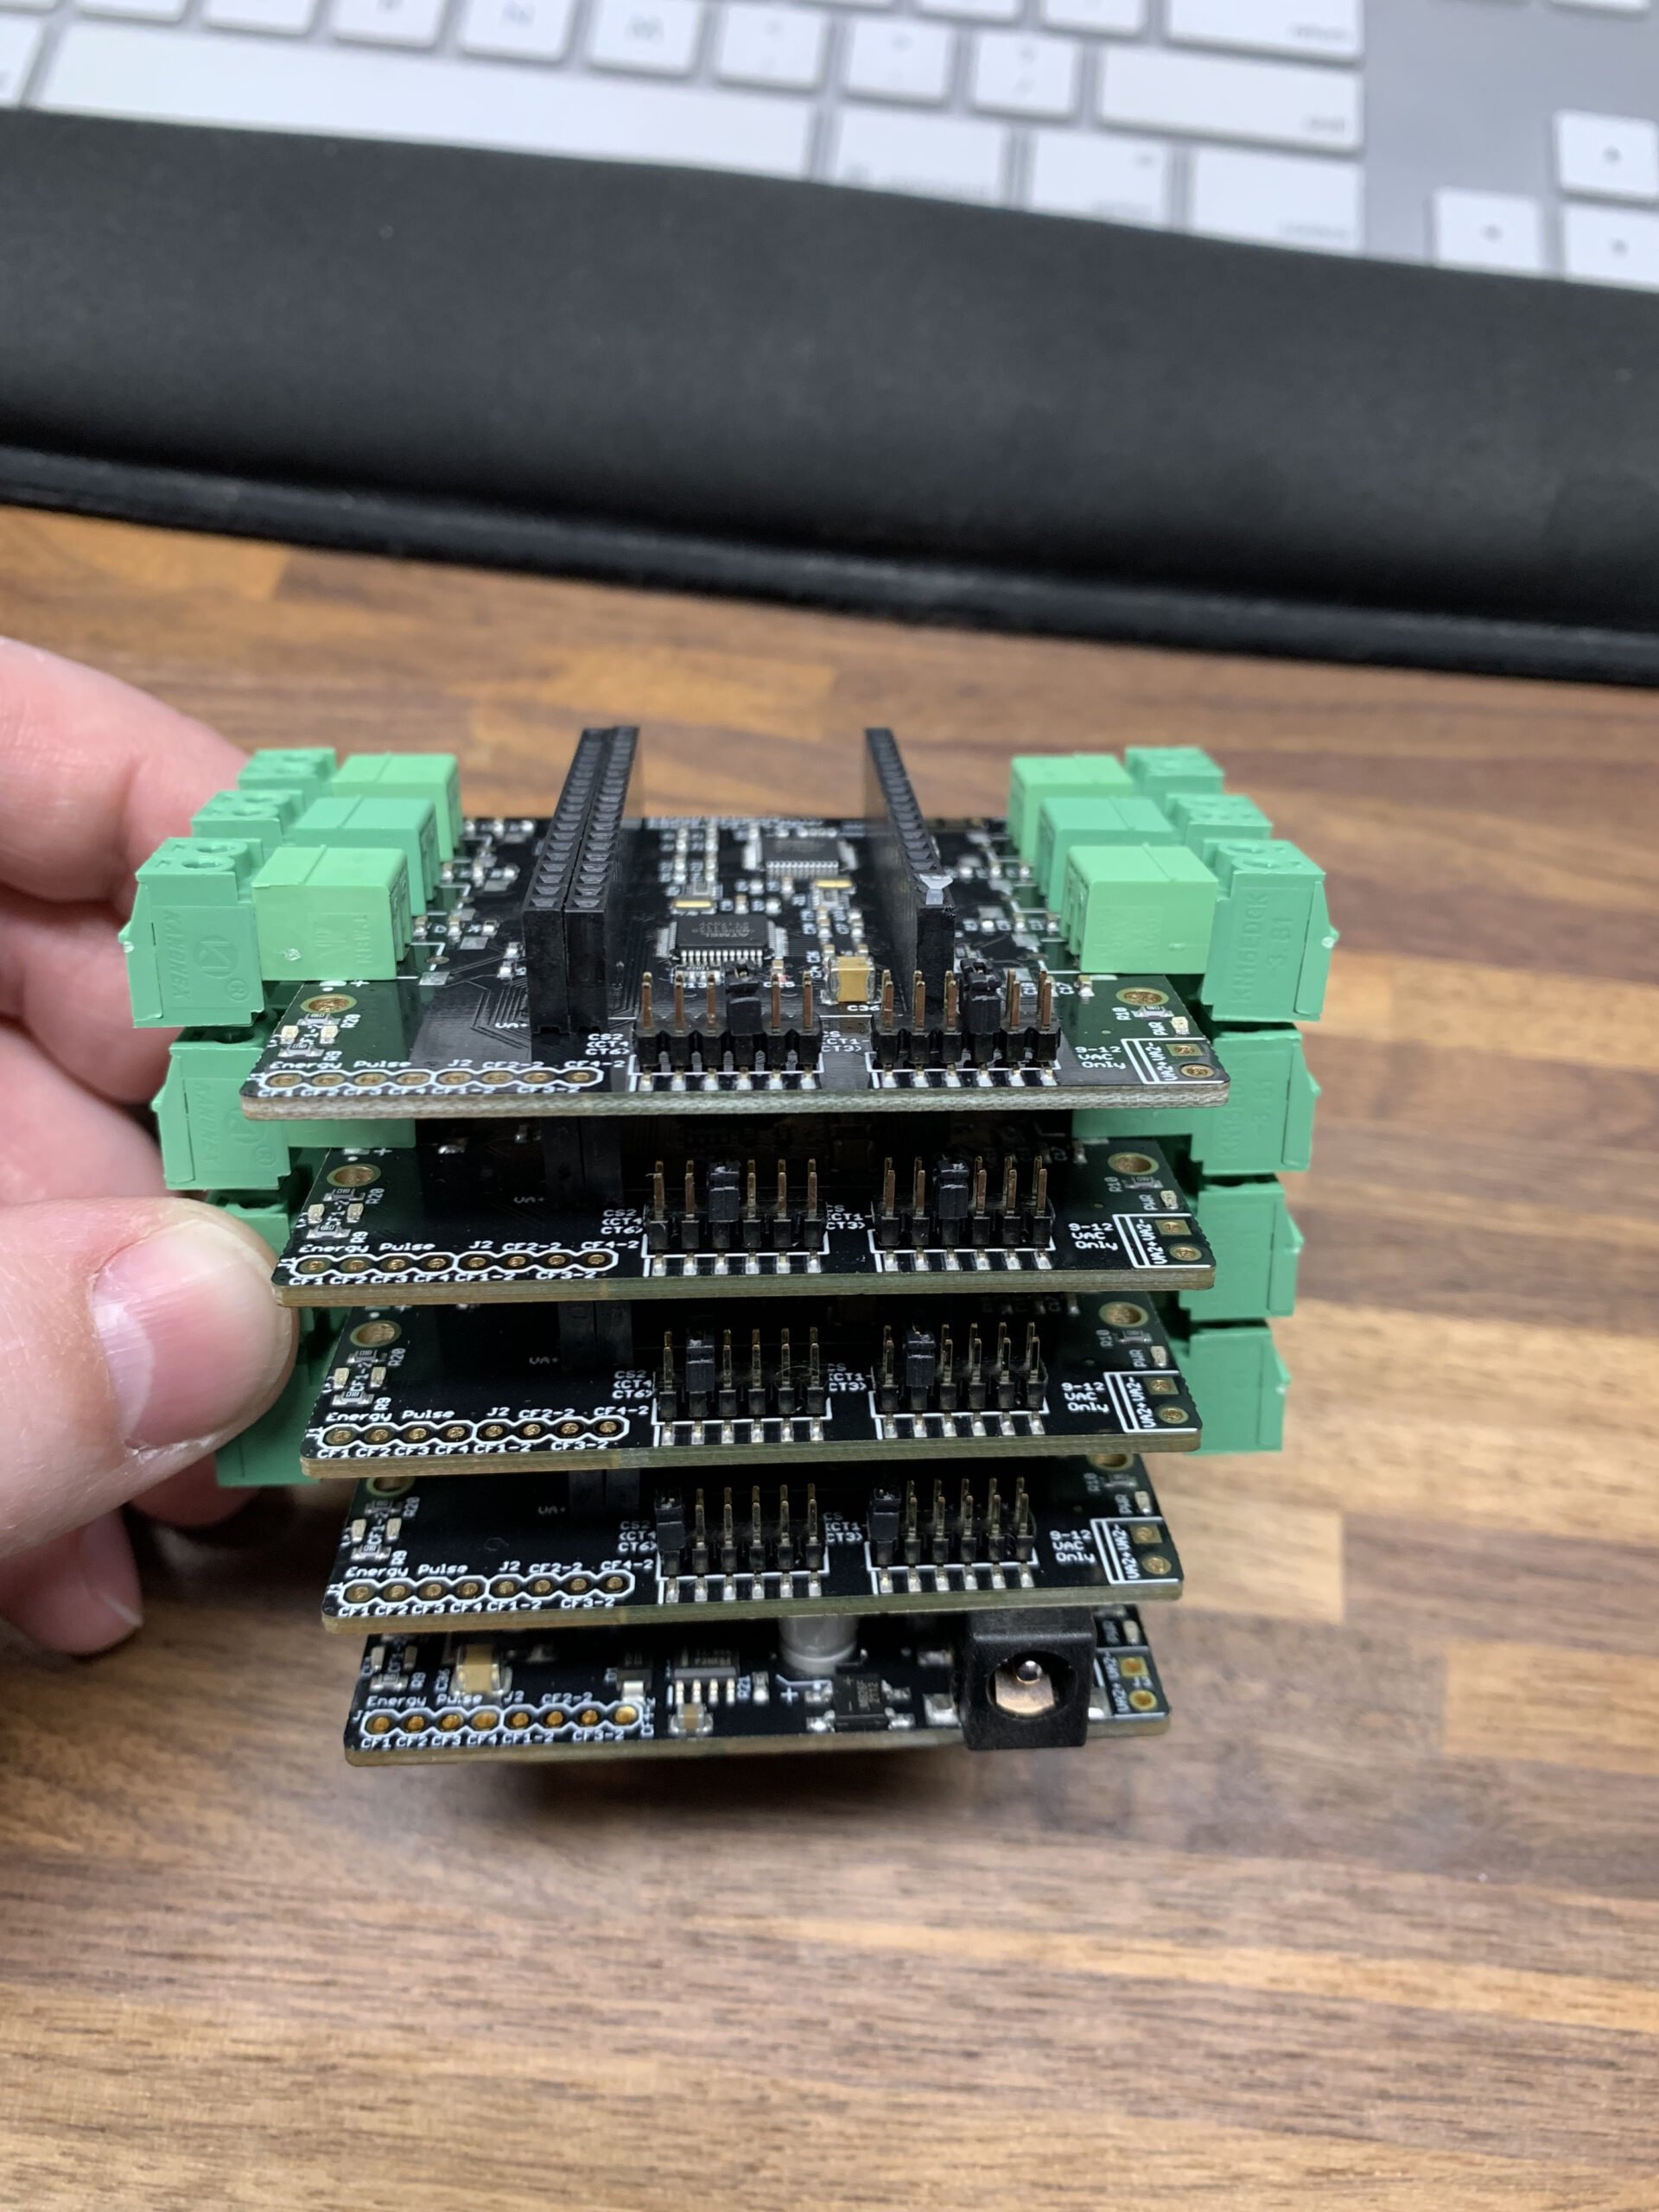
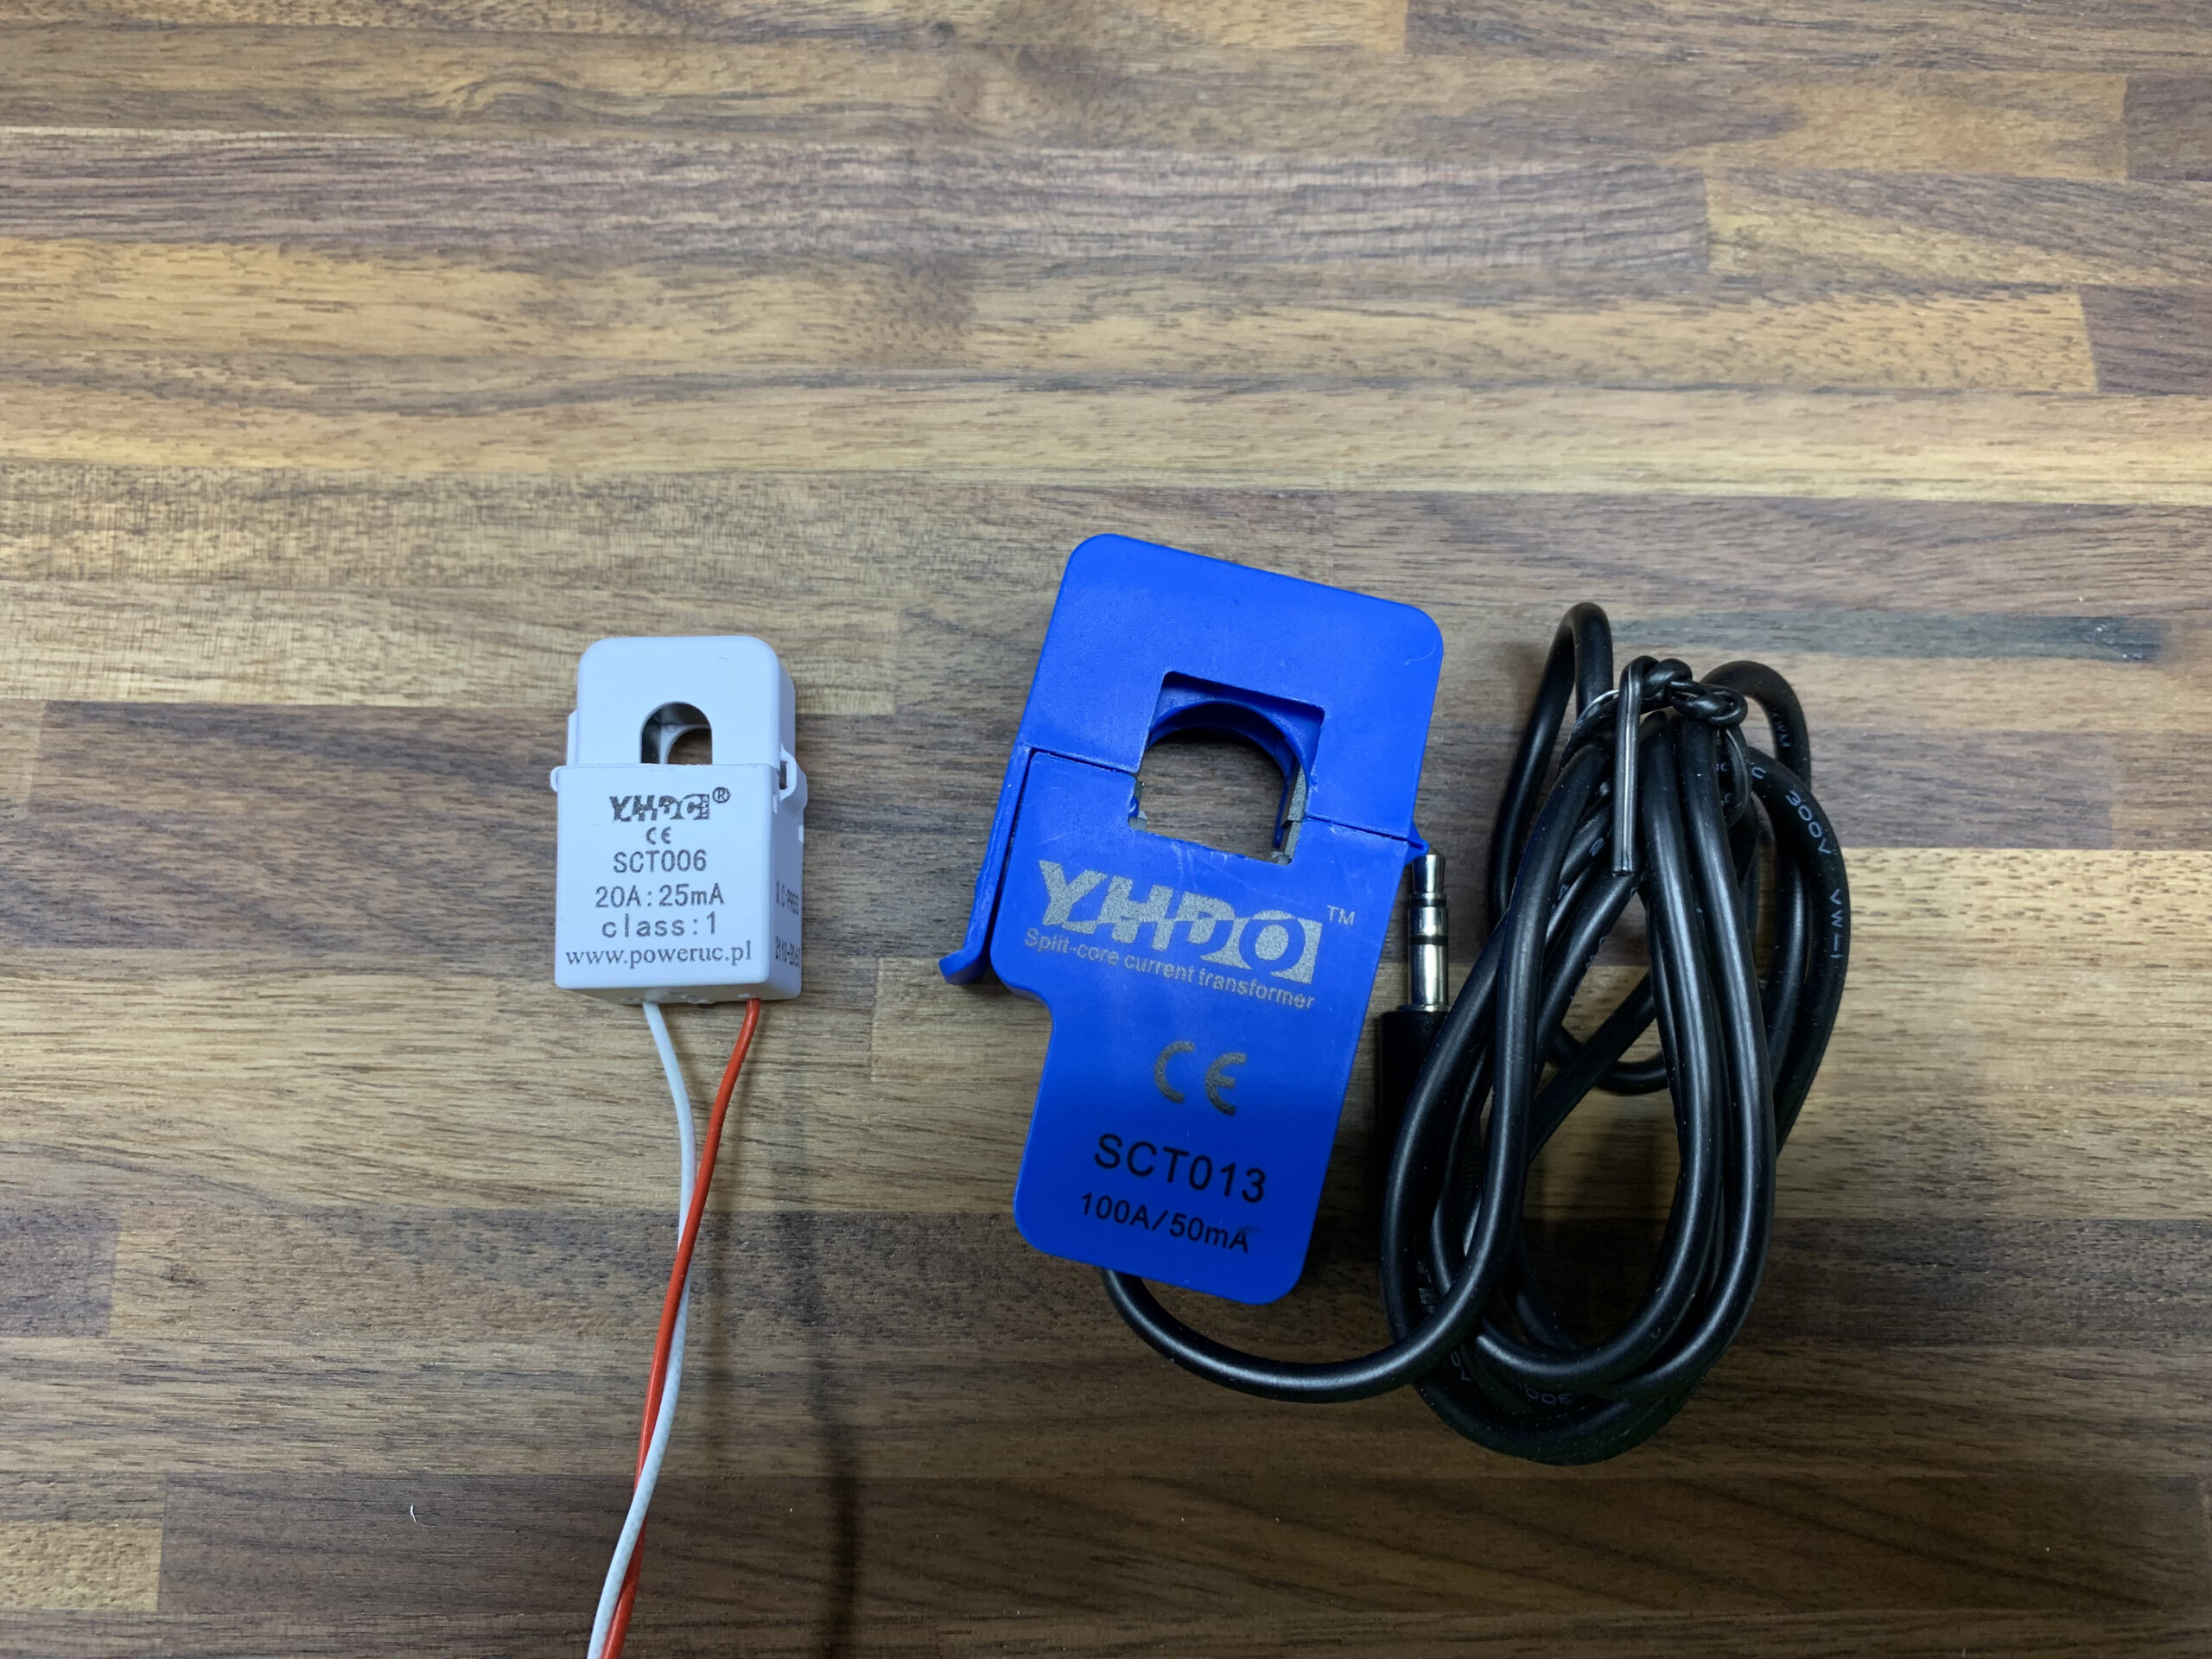
We found an open source project making metering boards that would handle the sensing, provided with external clamp-on current transformers. Some searching, and a group bulk order later, we had a sensor board stack based on the ESP32 and a bunch of transformer cores to start working with.

We found a library for CircuitPython that had the start of what we needed, but appeared to be abandoned for some time, and needed some additional help to do everything we needed it to. After reaching out to the prior creator, we forked the repo and have been making a fair number of improvements/additions.
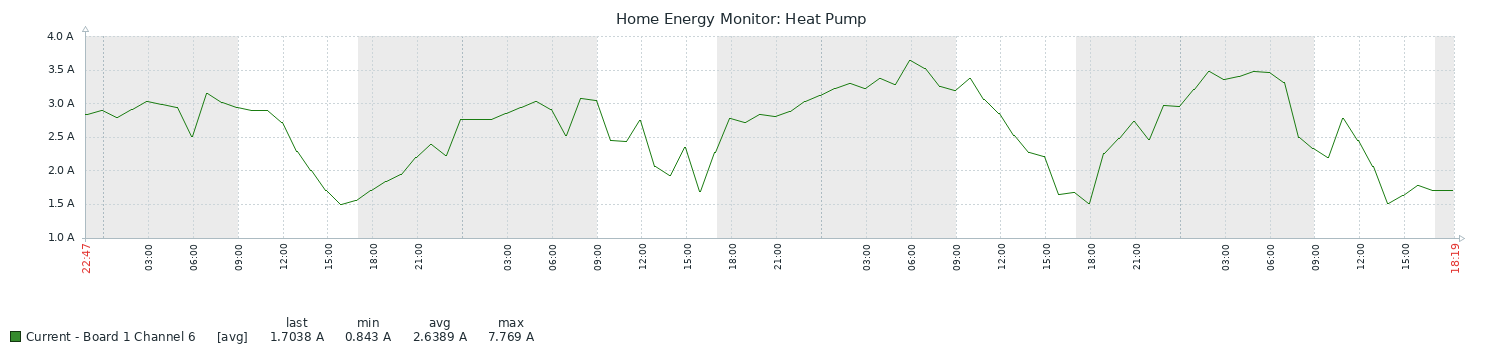
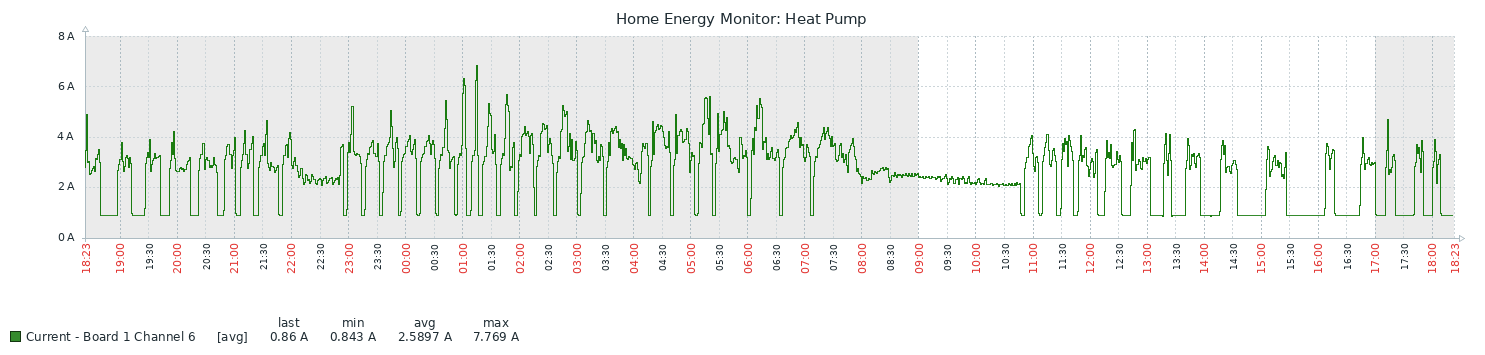
The new code is working well, and I have it tied into my general monitoring system, providing nice graphs. Here are some example graphs, with a longer timescale one covering several days, where we can see the heat pump usage as it works harder during the night as temperatures fall, and usage drops during the day as the temperatures come up. As well as a shorter timescale graph covering just 24 hours were we can see the individual cycles the system is running that the graphing system averages out over the longer timescale.