So, as pointed out in my last post, I got some HX1 transmitter modules, and hooked them up, however, it appears that the deviation is kinda funky when it comes to APRS. In this line of thinking, I decided to actually make a test of it, and feed the HX1 with a function generator. So that’s what I did.
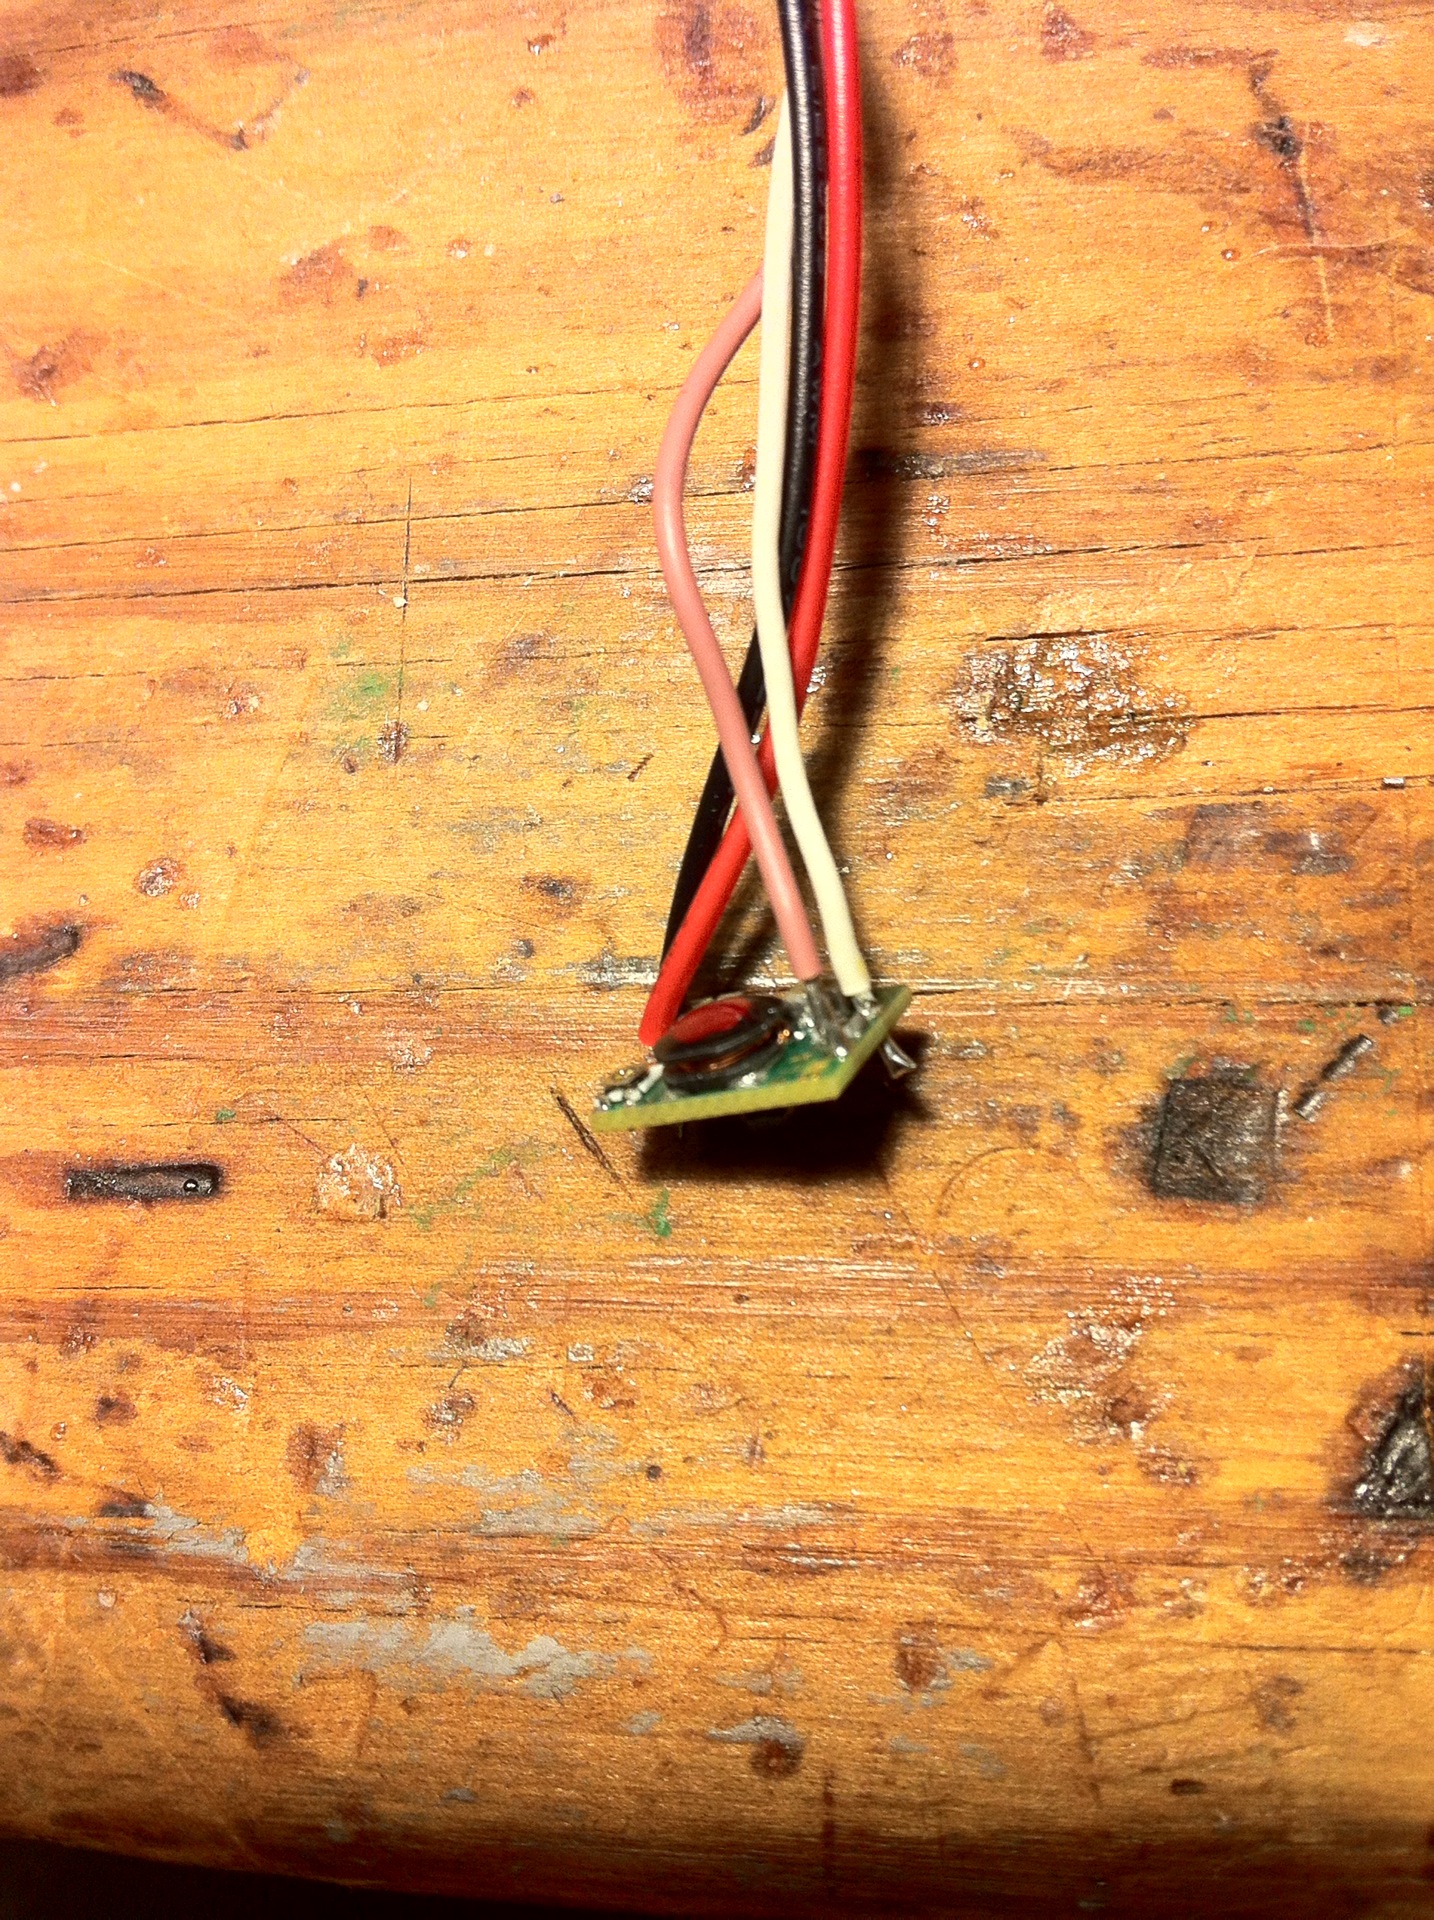
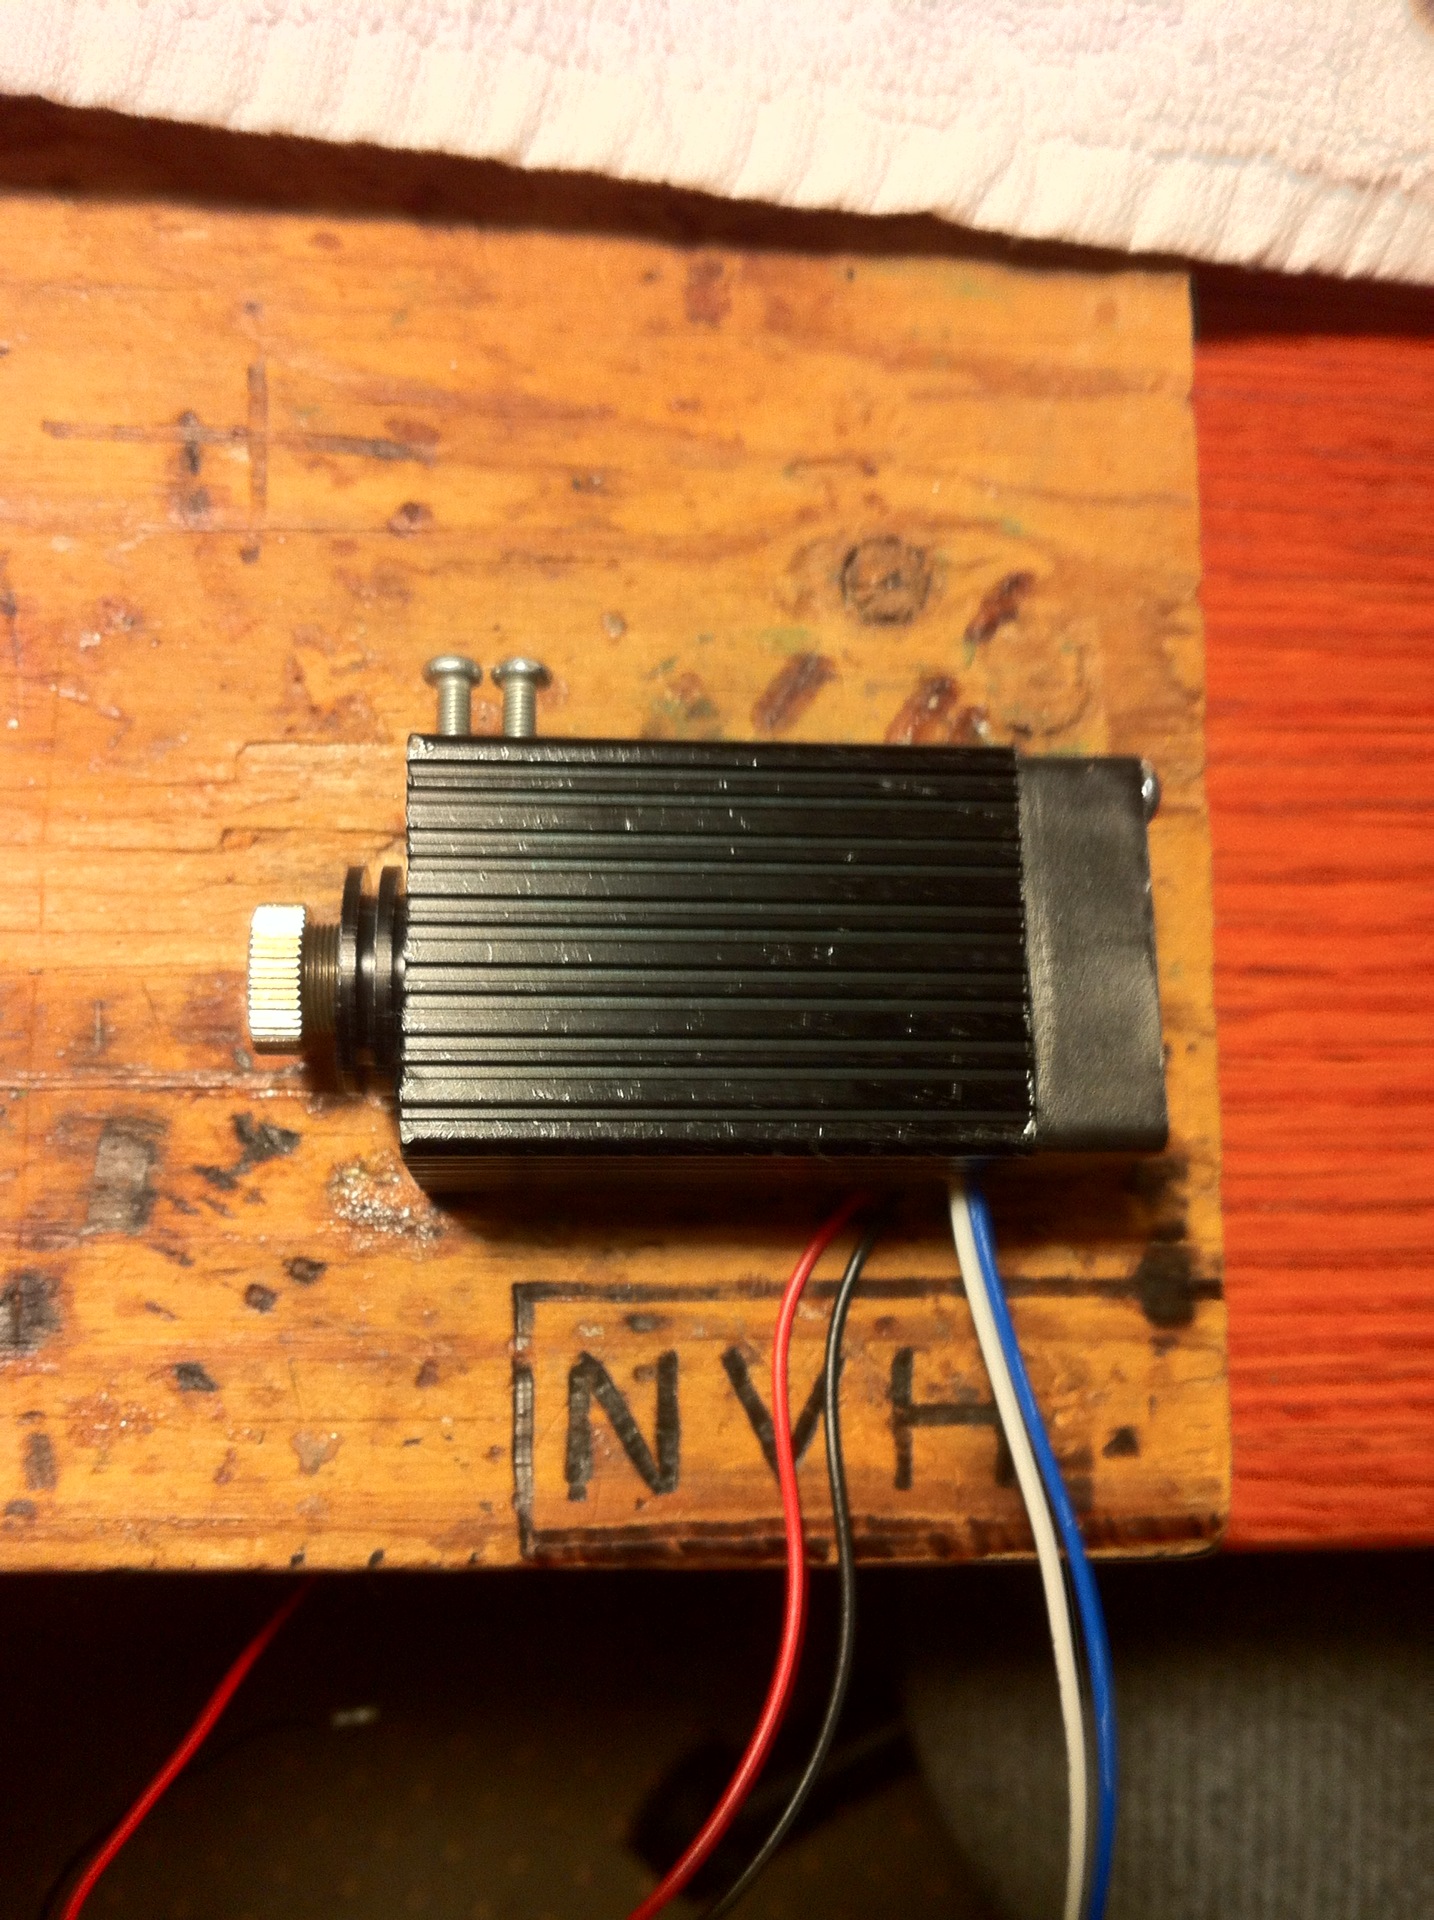
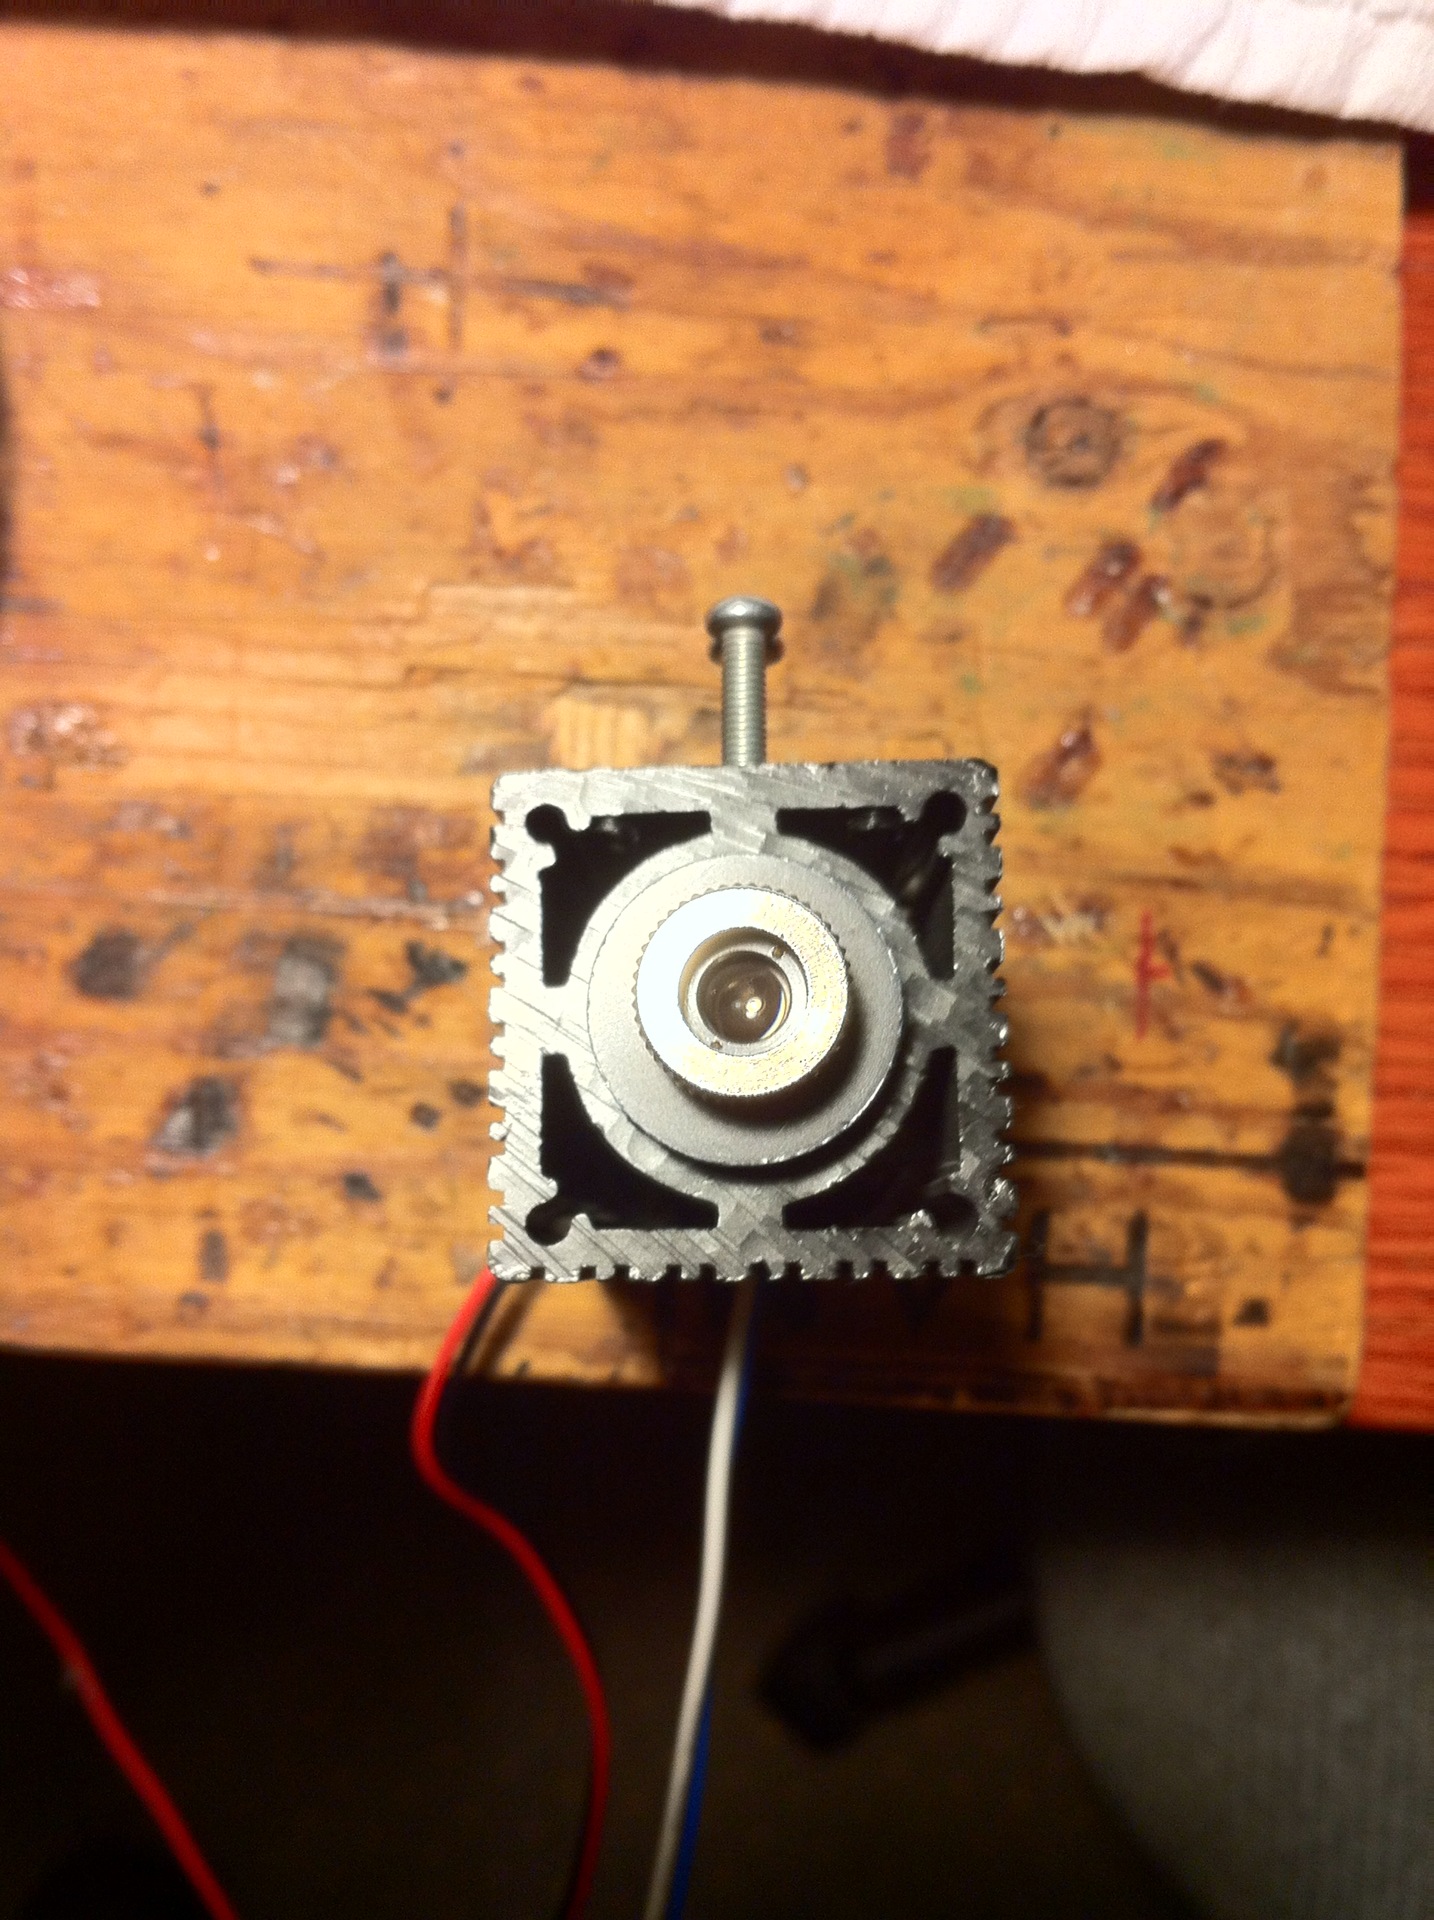
My test setup was the following, a signal generator, outputting a 2V P-P sine wave audio signal, feeding into the HX1 radio module, connected to a dummy load, being received by a Yaesu FT-8900R transciever, which has the external speaker port connected to an oscilloscope.
A couple of notes about the test setup.
1.) The amplitude of the signal generator was a constant 2V P-P through the frequency range (confirmed with the oscilloscope).
2.) I have no way to get a good reading on the actual deviation of the HX1 using only the audio level of the 8900. All numbers are relative rather than absolute.
3.) I can confirm that the 8900 audio response good at least through 2200Hz as looking at local APRS signals shows the 1200 and 2200Hz tones to have the same amplitude.
4.) Values in the spreadsheet are approximate. They’re pretty close. Also, like I said, they’re relative rather than absolute. So don’t use them for anything!
Enough of the stupid disclaimers. Here’s the results.

As you’ll note. The audio response peaks at about 400Hz, and slopes off as the frequency increases. You’ll also note that the chart starts at 300Hz. That’s because the radio module did not seem to be stable, or would not output anything near a sine wave below about 300Hz.
You’ll also note that for Packet Radio use, this is rather unfortunate, as at 1200Hz the output was at 0.6V and at 2200Hz the output was at 0.215V. With some crappy, lazy, head math tells me that the 2200Hz high tone of the Packet protocol only has about 1/3 the deviation of the 1200Hz low tone. Not a very good setup…
Anyway, here’s the spreadsheet in xlsx format. Do with it what you will. Spreadsheet